logo

Hot & Cold Numbers: A Structured Approach to Lottery Number Selection

Learn how to use frequency analysis to create more systematic number selections that avoid common mistakes and spread your picks across the entire number pool.

What You'll Gain

Create systematic number selection avoiding birthday clustering (1-31)
Learn to balance hot, cold, and neutral numbers for diverse tickets
Develop structured, repeatable selection process based on recent data
Reduce overlap with common player patterns that limit prize sharing

Learning Pathway

Your structured journey to mastery

Prerequisites

Basic understanding of lottery game mechanics
Familiarity with simple statistical concepts (mean, standard deviation)
Access to recent draw history data for your preferred lottery game

What You'll Learn

1
Master the mathematical foundation of frequency analysis
2
Learn to calculate and interpret statistical thresholds for hot/cold classification
3
Develop skills in balancing number selection across different frequency categories
4
Create systematic ticket generation strategies that avoid common pitfalls
5
Apply probability theory to improve overall lottery play structure

Course Outline

Strategy Foundation

Understanding the core principles and applications of this lottery strategy

What This Strategy Is

Hot numbers are those that have appeared more frequently than average in recent draws, while cold numbers have appeared less frequently. This strategy uses both categories to create balanced tickets that cover a wider range of numbers, unlike random or repetitive picks.

It's not about predicting the next draw, but about making smarter, more systematic choices that spread your selections across the entire number pool. This approach helps avoid common mistakes like picking only birthdays (1-31) or choosing the same patterns as many other players.

Why This Works

While each lottery draw is mathematically independent, real-world players benefit enormously from structured selection processes. Most people gravitate toward birthdays (limiting numbers to 1-31) or choose consecutive sequences, creating predictable patterns.

By tracking frequencies and mixing hot/cold numbers, you naturally spread your selections across the entire number range. This diversification often improves your chances of hitting smaller prizes and reduces the likelihood of sharing jackpots with players using common patterns.

Best For

This method works best for beginners who want structure without complexity, and intermediate players seeking to move beyond random selection. If you currently choose numbers based on birthdays, lucky numbers, or quick-pick alternatives, this approach offers a more systematic foundation.

It's particularly valuable for regular players who purchase tickets consistently and want a repeatable process that adapts to recent draw patterns while maintaining mathematical sensibility.

Mathematical Foundation

Hot and cold analysis looks at which numbers appear more or less often than expected in recent draws, helping you create balanced tickets that cover more of the number pool.

Probability Theory

In every lottery draw, each number has the same chance of being selected. But when you look at 20-30 recent draws, some numbers will appear more often and others less often just due to random chance - this is completely normal.

For example, in a Powerball game over 30 draws, you'd expect each number to appear about 2-3 times on average. Some numbers might appear 5-6 times (hot), others just once or not at all (cold). This doesn't mean the game is biased - it's just random variation.

By grouping numbers into hot, cold, and neutral categories, you can create tickets that use numbers from across the entire range instead of clustering in common areas like birthdays (1-31). This systematic approach helps avoid the patterns many other players use.

Mathematical Formulas

Simple Classification Method

For Powerball (30 recent draws): Each number should appear about 2-3 times on average if perfectly random.

Hot: Numbers appearing 5+ times | Cold: Numbers appearing 0-1 times | Neutral: Numbers appearing 2-4 times

Recommended Number Mix

Powerball (5 main numbers): Try 3 hot + 1 cold + 1 neutral | Mega Millions (5 main): Same 3+1+1 approach | Always ensure 2-4 odd numbers and spread across number ranges

Key Statistics

3.67 appearancesExpected Frequency (30-draw window)

In a 6/49 game, each number should appear about 3.67 times over 30 draws if perfectly random

≥6 appearancesHot Number Threshold

Numbers appearing 6+ times in 30 draws are statistically above average (μ + 1σ)

≤1 appearanceCold Number Threshold

Numbers appearing once or not at all in 30 draws are significantly below average

12-15 hot, 8-12 coldTypical Hot/Cold Distribution

Most 30-draw windows yield 12-15 hot numbers and 8-12 cold numbers in 6/49 games

Full range utilizationNumber Range Coverage

Balanced selection uses numbers from the entire pool (1-69) vs. birthday picks limited to 1-31

Data Analysis

Visual representations of our mathematical findings

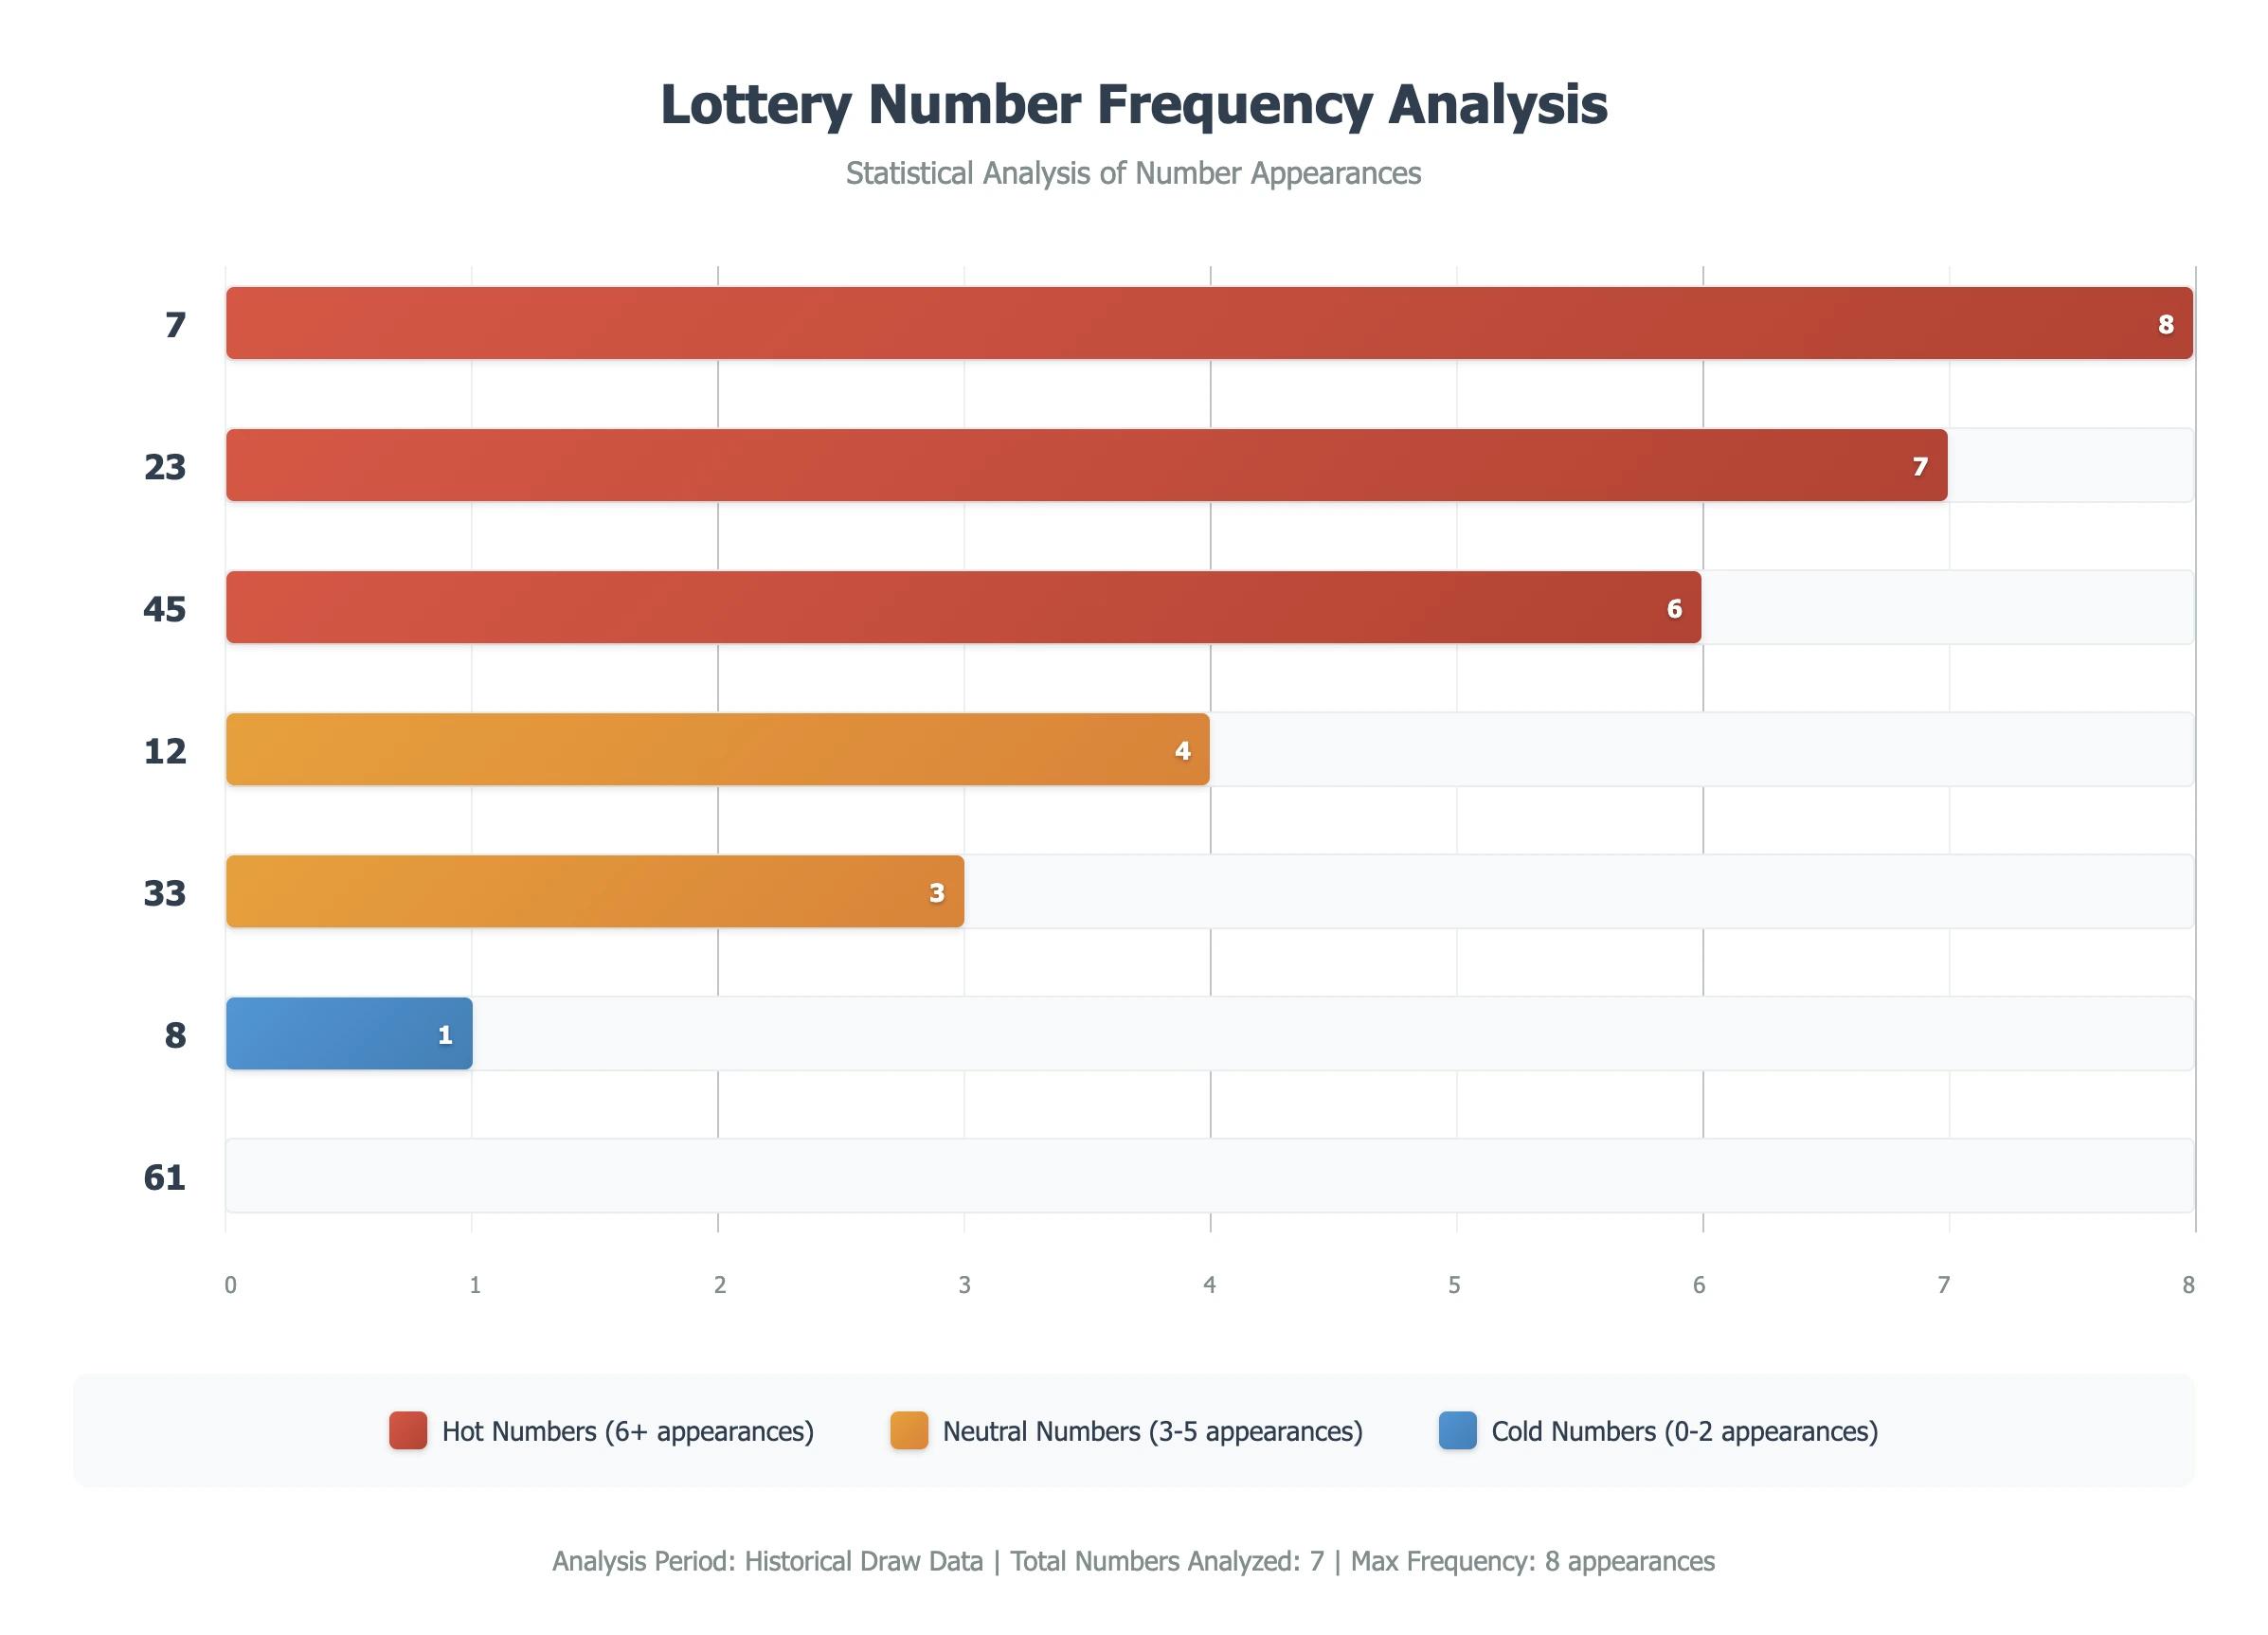
Sample Hot/Cold Classification (Powerball Main Numbers)

Data Analysis

Number 7 8 appearances (Hot)
Number 23 7 appearances (Hot)
Number 45 6 appearances (Hot)
Number 12 4 appearances (Neutral)
Number 33 3 appearances (Neutral)
Number 8 1 appearance (Cold)
Number 61 0 appearances (Cold)

30-draw analysis showing frequency counts and classifications for numbers 1-69

Sample Frequency Analysis: 30 Powerball Draws

Data Analysis

Example showing how numbers might be distributed in a typical 30-draw analysis window

Example showing how numbers might be distributed in a typical 30-draw analysis window

Number Selection Pattern Comparison

Data Analysis

Birthday Method Uses only numbers 1-31 (45% of pool)
Hot/Cold Balanced Uses numbers across full 1-69 range
Quick Pick Random Computer-generated across full range
Consecutive Sequences Often clusters in small ranges
Advantage Balanced approach reduces overlap with birthday players

Comparison of how different approaches use the Powerball number pool (1-69)

Implementation Guide

Follow these steps to successfully implement this strategy in your lottery play

1

Collect recent frequency data

Use the last 20–50 draws for your game. Count appearances for each number in the main pool and compute mean (μ) and standard deviation (σ).

Action Items

  • Pick a window W (e.g., 30 draws)
  • Count occurrences per number
  • Compute μ and σ to set thresholds

Pro Tips

Tip 1: Shorter windows (20-25 draws) react quickly to recent patterns but can be influenced by small streaks. Longer windows (40-50 draws) provide more stable classifications but may miss emerging trends.
Tip 2: Most players find 30 draws to be the sweet spot – stable enough to avoid noise, responsive enough to catch meaningful patterns.
2

Classify hot and cold

Mark a number hot if its frequency ≥ μ + 1σ and cold if ≤ μ − 1σ. Others are neutral. Adjust thresholds if you get too few or too many hot/cold numbers.

Action Items

  • List hot (≥ μ + 1σ)
  • List cold (≤ μ − 1σ)
  • Leave the rest as neutral

Pro Tips

Tip 1: If you end up with too few hot or cold numbers (less than 8-10 in each category), consider relaxing your threshold to ±0.5σ instead of ±1σ. This gives you more numbers to work with.
Tip 2: In practice, some experienced players use slightly different thresholds for hot vs. cold (e.g., +0.8σ for hot, -1.2σ for cold) to account for psychological preferences.
3

Build a balanced ticket mix

For 5-number games, start with a 3 hot / 1 cold / 1 neutral mix. For 6-number games, try 3 hot / 2 cold / 1 neutral. Avoid consecutive runs and keep odd/even balanced.

Action Items

  • Choose a hot-cold-neutral ratio for your game
  • Avoid consecutive sequences and duplicates
  • Balance odd/even and low/high ranges

Pro Tips

Tip 1: Once you've selected your hot, cold, and neutral numbers, randomize the order in which you choose from each category. This prevents subconscious bias toward lower or higher numbers within each group.
Tip 2: Pay attention to odd/even balance – most winning combinations have 2-4 odd numbers and 2-4 even numbers. Avoid tickets with all odds or all evens.
Tip 3: Check your final ticket against consecutive sequences. While not mathematically worse, consecutive numbers (like 7,8,9) are chosen by many players, potentially reducing your share of any prize.
4

Review cost and iterate

Limit tickets to your budget. Recompute classifications weekly or after major streak changes. Keep logs to compare outcomes over time.

Action Items

  • Set a budget per draw
  • Refresh classifications periodically
  • Track results to refine ratios

Pro Tips

Tip 1: Set your lottery budget before you start analyzing numbers, and stick to it regardless of how 'hot' your selected numbers appear. This strategy is about structure, not guarantees.
Tip 2: Keep a simple log of your classifications and results. After 3-6 months, review which ratios and window sizes worked best for your preferred games.
Tip 3: Major pattern shifts (like a cold number suddenly becoming very hot) might signal when to refresh your entire classification earlier than your usual schedule.

Case Studies & Examples

Real-world applications and simulated scenarios demonstrating this strategy in action

Step-by-Step Powerball Example

Scenario

Let's walk through applying the hot/cold strategy to Powerball's main numbers (5 numbers from 1-69) using data from 30 recent draws. This example shows exactly how to classify numbers and build a balanced ticket.

Implementation

Step 1: After analyzing 30 draws, we found these patterns: Hot numbers (5+ appearances): 7, 23, 45, 52, 63. Cold numbers (0-1 appearances): 8, 16, 34, 41, 61. Neutral numbers (2-4 appearances): 12, 29, 33, 38, 49.

Step 2: Build ticket using 3 hot + 1 cold + 1 neutral: Selected 7, 23, 45 (hot), 8 (cold), 12 (neutral). Check balance: 3 odd numbers (7, 23, 45), 2 even (8, 12). Range spread: numbers from first half (7, 8, 12, 23) and second half (45). Final ticket: 7-8-12-23-45.

Results & Analysis

This ticket avoids common mistakes like using only birthdays (1-31) or consecutive numbers. It covers both hot and cold categories while maintaining good odd/even and range balance. Remember: this is a systematic approach, not a prediction method. Every draw remains random.

Note: These examples are for educational purposes and may include simulated scenarios. Past performance does not guarantee future results. Lottery outcomes are random and unpredictable.

Performance & Resources

Data-driven insights and tools to maximize your strategy effectiveness

Strategy Performance Insights

Explore realistic, data-backed metrics to understand how wheeling systems improve your lottery play, with clear win rates, cost efficiency, and game-specific effectiveness.

Selection Benefits

Structured selection helps diversify your picks across the number pool, potentially improving chances of smaller prize wins compared to repetitive patterns like birthdays

Mathematical Reality

Maintains the same mathematical odds as any lottery strategy, but creates more varied ticket selections that may reduce prize sharing

Game Compatibility

Powerball
Odds: 1 in 292,201,338
Moderate

Best used for main number pool; Powerball number can be selected using separate frequency analysis

Mega Millions
Odds: 1 in 302,575,350
Moderate

Similar effectiveness to Powerball; strategy particularly valuable for reducing birthday clustering in main pool

6/49 Regional
Odds: 1 in 13,983,816
High

Optimal game format for this strategy; smaller number pool creates more stable hot/cold patterns

EuroMillions
Odds: 1 in 139,838,160
Moderate

Effective for main numbers (1-50); separate strategy needed for Lucky Stars (1-12)

Daily Pick Games (5/39)
Odds: 1 in 575,757
High

Excellent results due to frequent draws allowing quick pattern recognition; update classifications weekly

Recommended Tools & Resources

Essential tools to help you implement this strategy effectively

Quick Pick Generator

Instantly generate numbers for your favorite lottery games for free. Customize your picks by including or excluding numbers and create multiple sets at once with a single click.

Try This Tool

Common Pitfalls to Avoid

Learn from these common mistakes to improve your strategy implementation

Pitfall #1: Going All-In on Hot Numbers Only

Why This Is Problematic

Many beginners think 'if hot numbers are appearing more often, I should use only hot numbers!' This logic seems sound but creates dangerous clustering. You're essentially betting that recent trends will continue indefinitely, which ignores the random nature of lottery draws.

Additionally, all-hot selection often concentrates your numbers in specific ranges, reducing your overall coverage and increasing the chance that you'll share prizes with other players using similar 'hot number' strategies.

The Right Approach

Use the balanced 3:1:1 or 3:2:1 ratios as designed. The strategy's power comes from structured diversification, not from doubling down on recent patterns. Mix hot numbers with cold and neutral selections to create tickets that hedge across different statistical scenarios.

Pitfall #2: Set-and-Forget Classification (Never Updating)

Why This Is Problematic

Some players create their hot/cold classifications once and use them for months without updates. This defeats the entire purpose of frequency analysis, which is designed to adapt to changing patterns in lottery draws.

Stale classifications become increasingly meaningless as new draws accumulate. Your 'hot' numbers from three months ago might now be the coldest numbers in the current data, making your strategy counterproductive.

The Right Approach

Establish a regular update schedule – weekly for frequent draws, bi-weekly for twice-weekly games. Set phone reminders if needed. The 10-15 minutes spent updating classifications is essential maintenance that keeps your strategy relevant to current patterns.

Pitfall #3: Ignoring Odd/Even and Range Balance

Why This Is Problematic

Players often get so focused on hot/cold categories that they forget basic distribution principles. They might select 3 hot, 1 cold, and 1 neutral number, but end up with all odd numbers or all numbers from 1-25, creating unbalanced tickets.

The Right Approach

After selecting from your frequency categories, always check odd/even balance (aim for 2-4 odds) and range distribution (roughly half from each half of the number pool). If your initial selection is unbalanced, swap numbers within the same frequency category to fix the distribution.

Pitfall #4: Over-Analyzing and Changing Systems Constantly

Why This Is Problematic

Some players become obsessed with tweaking their approach after every drawing. They constantly adjust thresholds, change ratios, or abandon the strategy entirely after a few drawings without wins, never giving the systematic approach time to demonstrate its benefits.

The Right Approach

Commit to your chosen approach for at least 3-6 months before making major adjustments. The strategy's value comes from consistent application over time, not from constant optimization. Track results monthly and make small refinements rather than dramatic overhauls.

Test Your Knowledge

Reinforce your learning with these interactive quizzes

Knowledge Checkpoint

What's a reasonable first ratio for 5-number games?

Strategy Comparisons

How this strategy stacks up against alternatives

vs. Random Number Selection

Advantages

Adds structure and reduces common biases

Trade-offs

Requires periodic data updates

Frequently Asked Questions

Get answers to common questions about this strategy

Does using hot numbers increase my odds of winning?

No, hot numbers don't improve your chances of winning the jackpot, as every draw is completely random. This strategy helps you pick numbers more systematically, spreading them across the number pool to avoid common patterns like birthdays and potentially reduce prize sharing for smaller wins.

How often should I update my classifications?

Update your hot/cold classifications weekly for frequent draws like Powerball and Mega Millions. This keeps your analysis current with recent patterns while avoiding over-analysis that can lead to constantly changing strategies.

Can this strategy guarantee I'll win something?

No strategy can guarantee lottery wins. Lotteries are designed with extremely low odds, and every combination has the same mathematical chance. This method simply helps you make more systematic choices and avoid common selection patterns that many players use.

Why not just use all hot numbers if they're appearing more?

Using only hot numbers creates dangerous clustering and reduces your number range coverage. The balanced approach (mixing hot, cold, and neutral) helps spread your picks across the entire pool and avoids putting all your eggs in one basket based on recent patterns.

Plus

Unlock Plus: Advanced Lottery Tools & Insights

Join Lottery Valley Plus to access advanced AI predictions, unlimited history, and expert analysis to maximize your lottery strategy.

AI-powered number predictions & analysis
Advanced pattern detection & trends
Unlimited results history & data export
Pool organization tools
Unlimited
History
Daily
AI Predictions
Smart
Tools
Budget
Tracking

Educational Resource Notice

Important: This content is designed for educational purposes to help you understand lottery mathematics and probability theory. No lottery strategy can guarantee wins or improve your mathematical odds of winning any prize tier.

Lotteries are random games of chance, and past results don't influence future outcomes. This strategy helps create more systematic selections that avoid common player mistakes, not predict winners. Always play responsibly within your budget.